(全文约4000字)
clusterProfiler相关的博客共有三篇,共同食用,效果更好 :wink: :
- 博客富集分析:(三)clusterProfiler概述
- 博客富集分析:(四) clusterProfiler:不同物种的GO+KEGG富集分析
- 博客富集分析:(五)clusterProfiler:Visualization
1. 可视化的输入数据
clusterProfiler的可视化一般只支持clusterProfiler富集分析结果的可视化,通过认识clusterProfiler可视化接受的输入数据的格式,可以修改其他富集分析结果文件的格式,来用clusterProfiler进行可视化绘图。
1.1. 可视化输入数据格式
- 查看ego格式
clusterProfiler的可视化包接受的输入数据是前面富集分析得到的结果(比如ego/kk),用str(ego)或class(ego)可以看到ego的格式是叫enrichResult的R的数据类型。1
2
3
4
5library(clusterProfiler)
> class(ego) #查看ego的数据类型/类
[1] "enrichResult"
attr(,"package")
[1] "DOSE"
如果手头没有ego数据,可以用clusterProfiler的样例数据快速得到一个edo,与ego格式一样。
1 | library(clusterProfiler) |
enrichResult(R的class类型)格式
在DOSE包中查到,enrichResult具体格式如下:1
2
3
4
5
6
7
8
9
10
11
12
13
14
15
16
17setClass("enrichResult",
representation=representation(
result = "data.frame",
pvalueCutoff = "numeric",
pAdjustMethod = "character",
qvalueCutoff = "numeric",
organism = "character",
style="margin: 0px; padding: 0px; color: rgb(221, 17, 68);">"character",
gene = "character",
keytype = "character",
universe = "character",
gene2Symbol = "character",
geneSets = "list",
readable = "logical"
),
prototype=prototype(readable = FALSE)
)result变量格式
enrichResult中最重要的是result,是储存富集结果的dataframe。
result变量与clusterProfiler富集分析中保存ego的结果文件是一致的。
1 | ego@result[c(13,14),] #查看ego的result变量的13,14行 |
一般而言result有9列。这里因为用enrichGO富集时ont参数选择ALL,结果就会在第一列前多一列ONTOLOGY。
- 第一列是ID,也就是富集通路的编号(GO:0010222);
- 第二列是Description,也就是富集通路的名称;
- 第三列是GeneRatio,也就是要富集的基因中在对应通路中的比例;
- 第4列是BgRation,也就是对应通过的基因在全基因组注释中的比例;
- 第5,6,7列都是统计检验的结果;
- 第8列是geneID,也就是富集到基因的名字,多个geneID是以斜线隔开的;
- 第9列是Count,也就是富集到的基因数目。
1.2. 输入数据准备
根据不同情况为clusterProfiler的可视化准备输入数据。
接着clusterProfiler富集分析做可视化
如果是接着clusterProfiler的enrichGO(),gseGO(),enricher(),gseGO()等函数的结果ego,不要关闭R环境,在R里直接进行用于下一步可视化即可。保存的clusterProfiler富集分析结果做可视化
- 如果是clusterProfiler的enrichGO(),gseGO(),enricher(),gseGO()等函数的结果
ego保存成的文件,已关闭R环境。 - 可导入文件,新建enrichResult对象ego,再进行下一步可视化。
- 这里假设用R命令
write.table(as.data.frame(ego),"go_enrich.csv",sep="\t",row.names =F,quote=F)保存ego在go_enrich.csv文件。1
2
3
4
5
6
7
8
9
10
11
12
13
14
15
16
17
18data<-read.table("go_enrich.csv",sep="\t",header=T,quote="")
head(data,2) #查看data前2行
ONTOLOGY ID Description GeneRatio
1 BP GO:0010222 stem vascular tissue pattern formation 12/349
2 BP GO:0010588 cotyledon vascular tissue pattern formation 12/349
BgRatio pvalue p.adjust qvalue
1 29/16975 1.792157e-13 2.107577e-10 1.790270e-10
2 39/16975 1.122611e-11 6.600951e-09 5.607145e-09
geneID
1 mc11300/mc11301/mc19080/mc19081/mc26300/mc31693/mc37850/mc40780/mc40781/mc40782/mc40784/mc40918
2 mc11300/mc11301/mc19080/mc19081/mc26300/mc31693/mc37850/mc40780/mc40781/mc40782/mc40784/mc40918
Count
1 12
2 12
geneID_all <- unlist(apply(as.matrix(data$geneID),1,function(x) unlist(strsplit(x,'/')))) #得到富集到的所用geneID
ego<-new("enrichResult", result=data, gene=geneID_all, pvalueCutoff=0.01,pAdjustMethod="BH",qvalueCutoff=0.05,ontology="BP",keytype="GID",universe='Unknown',geneSets=list(),organism="Unknown",readable=FALSE) #把data内容赋值给ego的result,geneID_all赋值给gene,每个富集到的GO对应的gene集应该赋值给geneSets(数据是字典(键值对是GOID和geneIDs)组成的列表,这里直接给了空的),ontology与enrichGO分析的ont参数一致,这里的pvalueCutoff=0.01,pAdjustMethod="BH",qvalueCutoff=0.05根据富集分析参数的设置,或者随意设置或者不设置也不会影响可视化。
- 其他来源富集分析结果可视化
如果是其他软件的富集分析结果,可以根据ego的result变量格式进行修改格式,改成go_enrich.csv相同的格式的文件,再按照上面的步骤导入文件,并保存到新建的ego对象。即可用clusterProfiler的可视化包可视化其他软件的富集分析结果了。
2. 功能富集结果可视化
下面的可视化大多基于在R中已获得富集分析的结果ego。
2.1. enrichplot包
enrichplot包有几种可视化方法来解释富集结果,支持clusterProfiler获得的ORA和GSEA富集结果。
2.1.1. 安装和载入
安装和载入enrichplot包
1 | BiocManager::install("enrichplot") |
2.1.2. 可视化包
- 推荐dotplot或barplot可视化前10个GO Terms条目。
- 推荐goplot有向无环图查看富集的GO Terms间的关系。
- 可视化barplot —— 条形图
将富集分数(例如p 值)和基因计数或比率描述为条形高度和颜色。横轴为该GO term下的差异基因个数,纵轴为富集到的GO Terms的描述信息, showCategory指定展示的GO Terms的个数为20个,默认展示显著富集的top10个,即p.adjust最小的10个。
barplot(ego, showCategory=20, title="EnrichmentGO_MF")
使用mutate导出的其他变量也可以用作条形高度或颜色。
1 | mutate(ego, qscore = -log(p.adjust, base=10)) %>% |
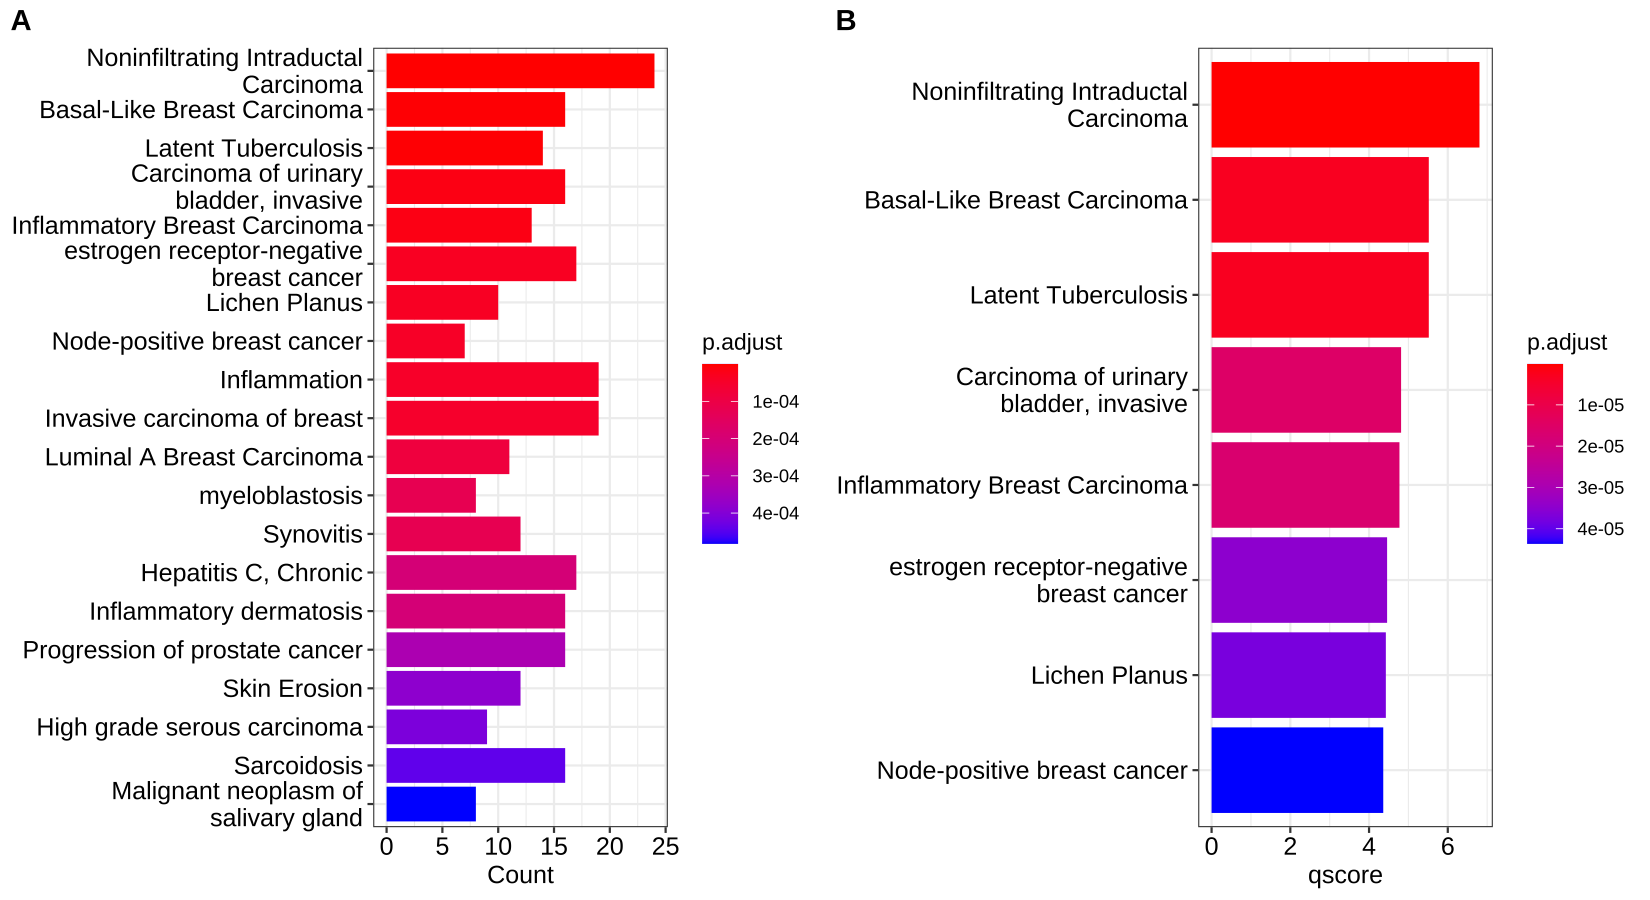
Figure 1. Bar plot of enriched terms
from clusterProfiler book
- 可视化dotplot —— 点阵图
dotplot(edo, showCategory=30) + ggtitle("dotplot for ORA")
dotplot(edo2, showCategory=30) + ggtitle("dotplot for GSEA")
散点图,横坐标为GeneRatio,纵坐标为富集到的GO Terms的描述信息,showCategory指定展示的GO Terms的个数,默认展示显著富集的top10个,即p.adjust最小的10个。
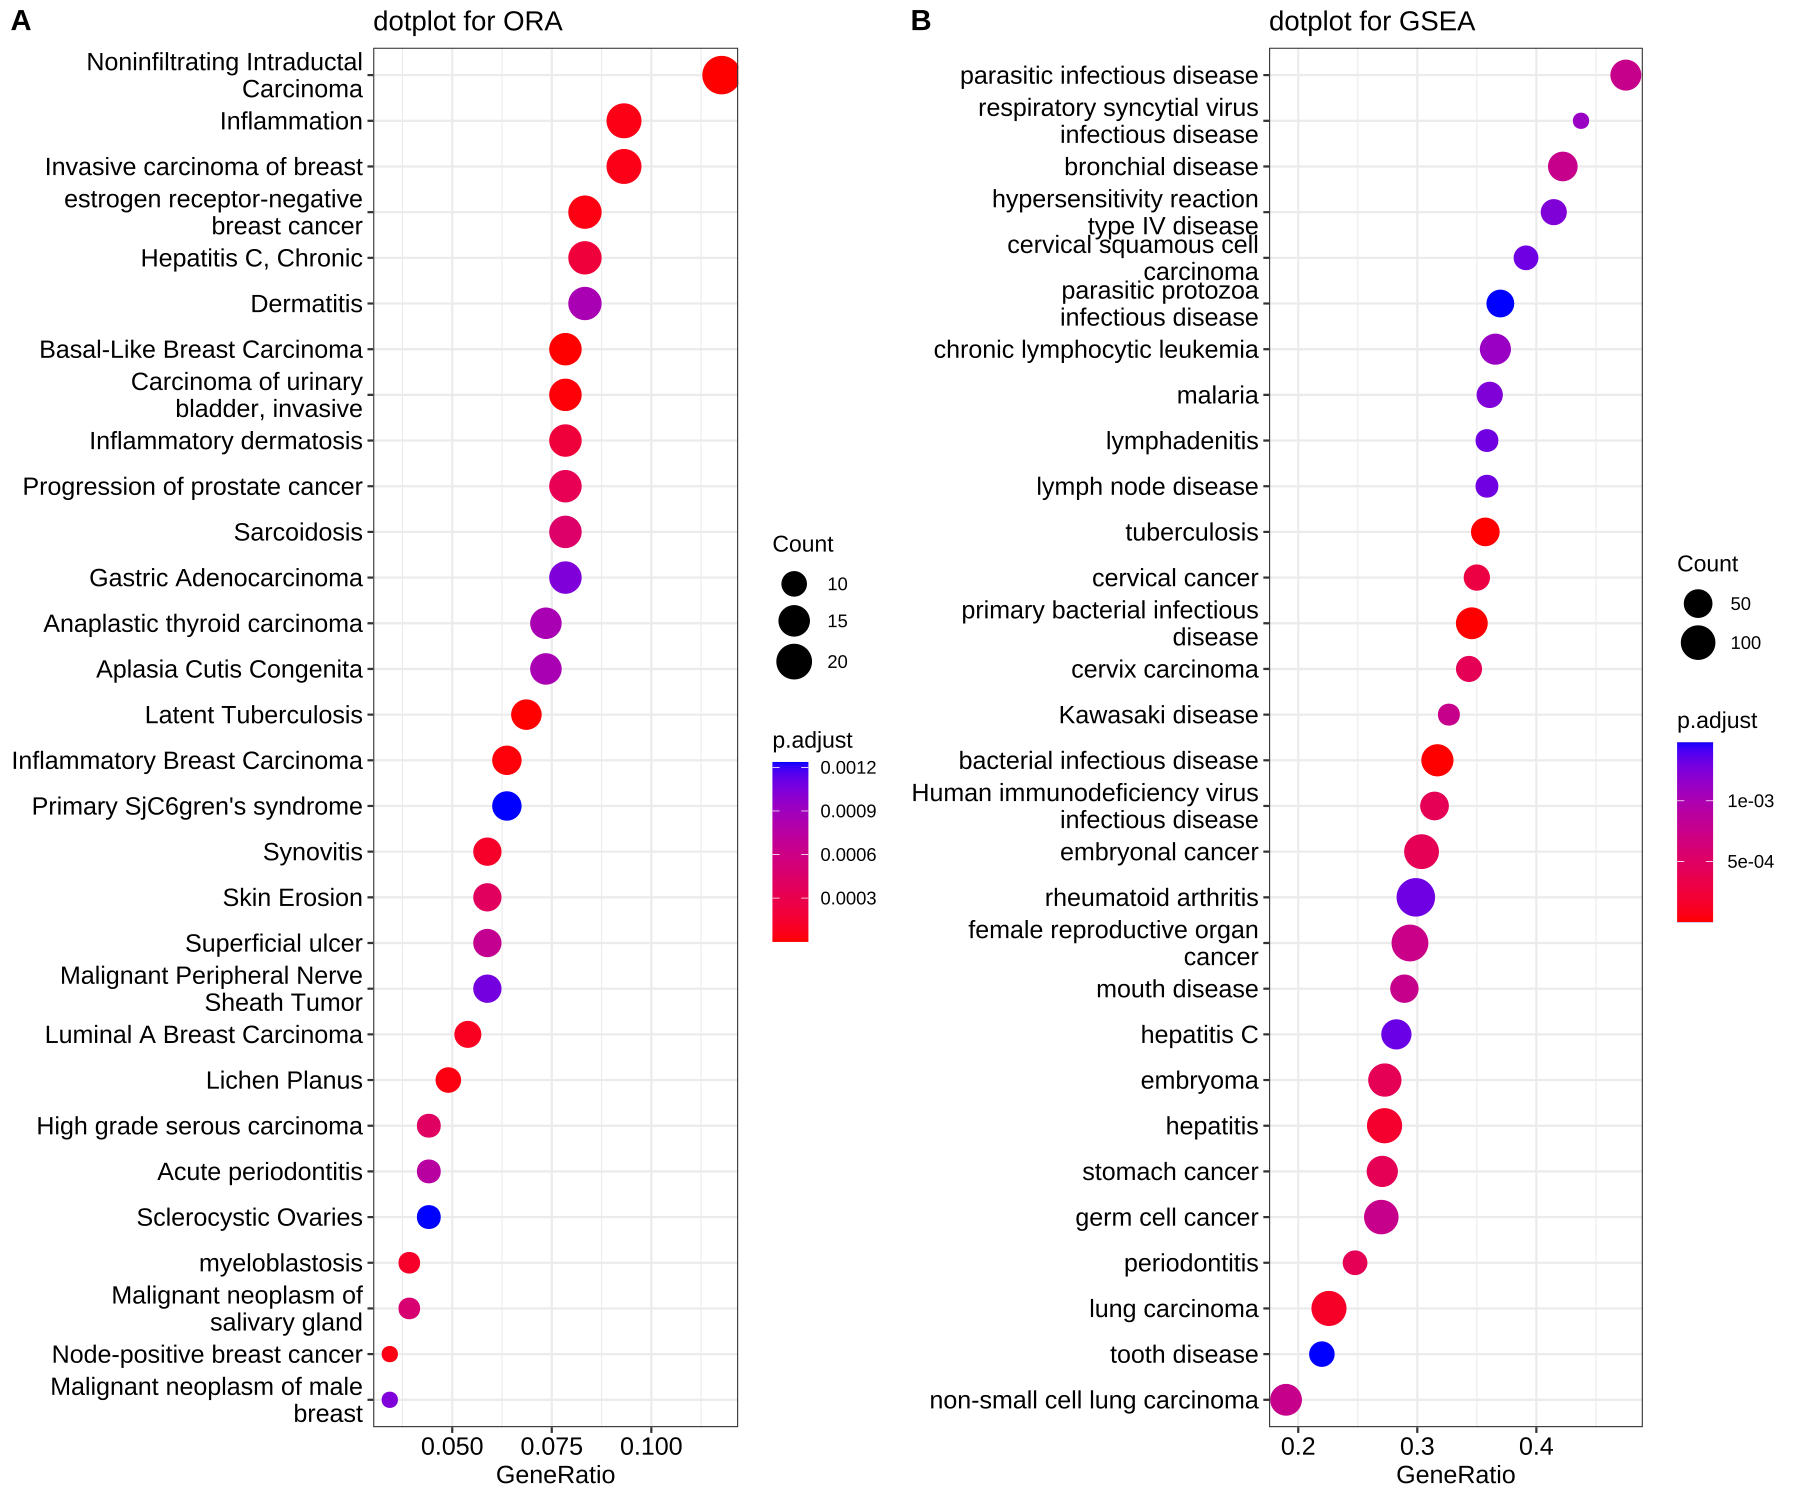
Figure 2. Dot plot of enriched terms
from clusterProfiler book
- 可视化cnetplot —— 类别网络图
cnetplot 将基因和生物学概念(例如 GO 术语或 KEGG 通路)的联系描述为一个网络(有助于查看哪些基因涉及富集通路和可能属于多个注释类别的基因)。对于基因和富集的GO terms之间的对应关系进行展示,如果一个基因位于一个GO Terms下,则将该基因与GO连线。图中灰色的点代表基因,黄色的点代表富集到的GO terms, 默认画top5富集到的GO terms, GO 节点的大小对应富集到的基因个数。
cnetplot(ego, categorySize = "pvalue", foldChange = gene_list
1 | ## convert gene ID to Symbol |
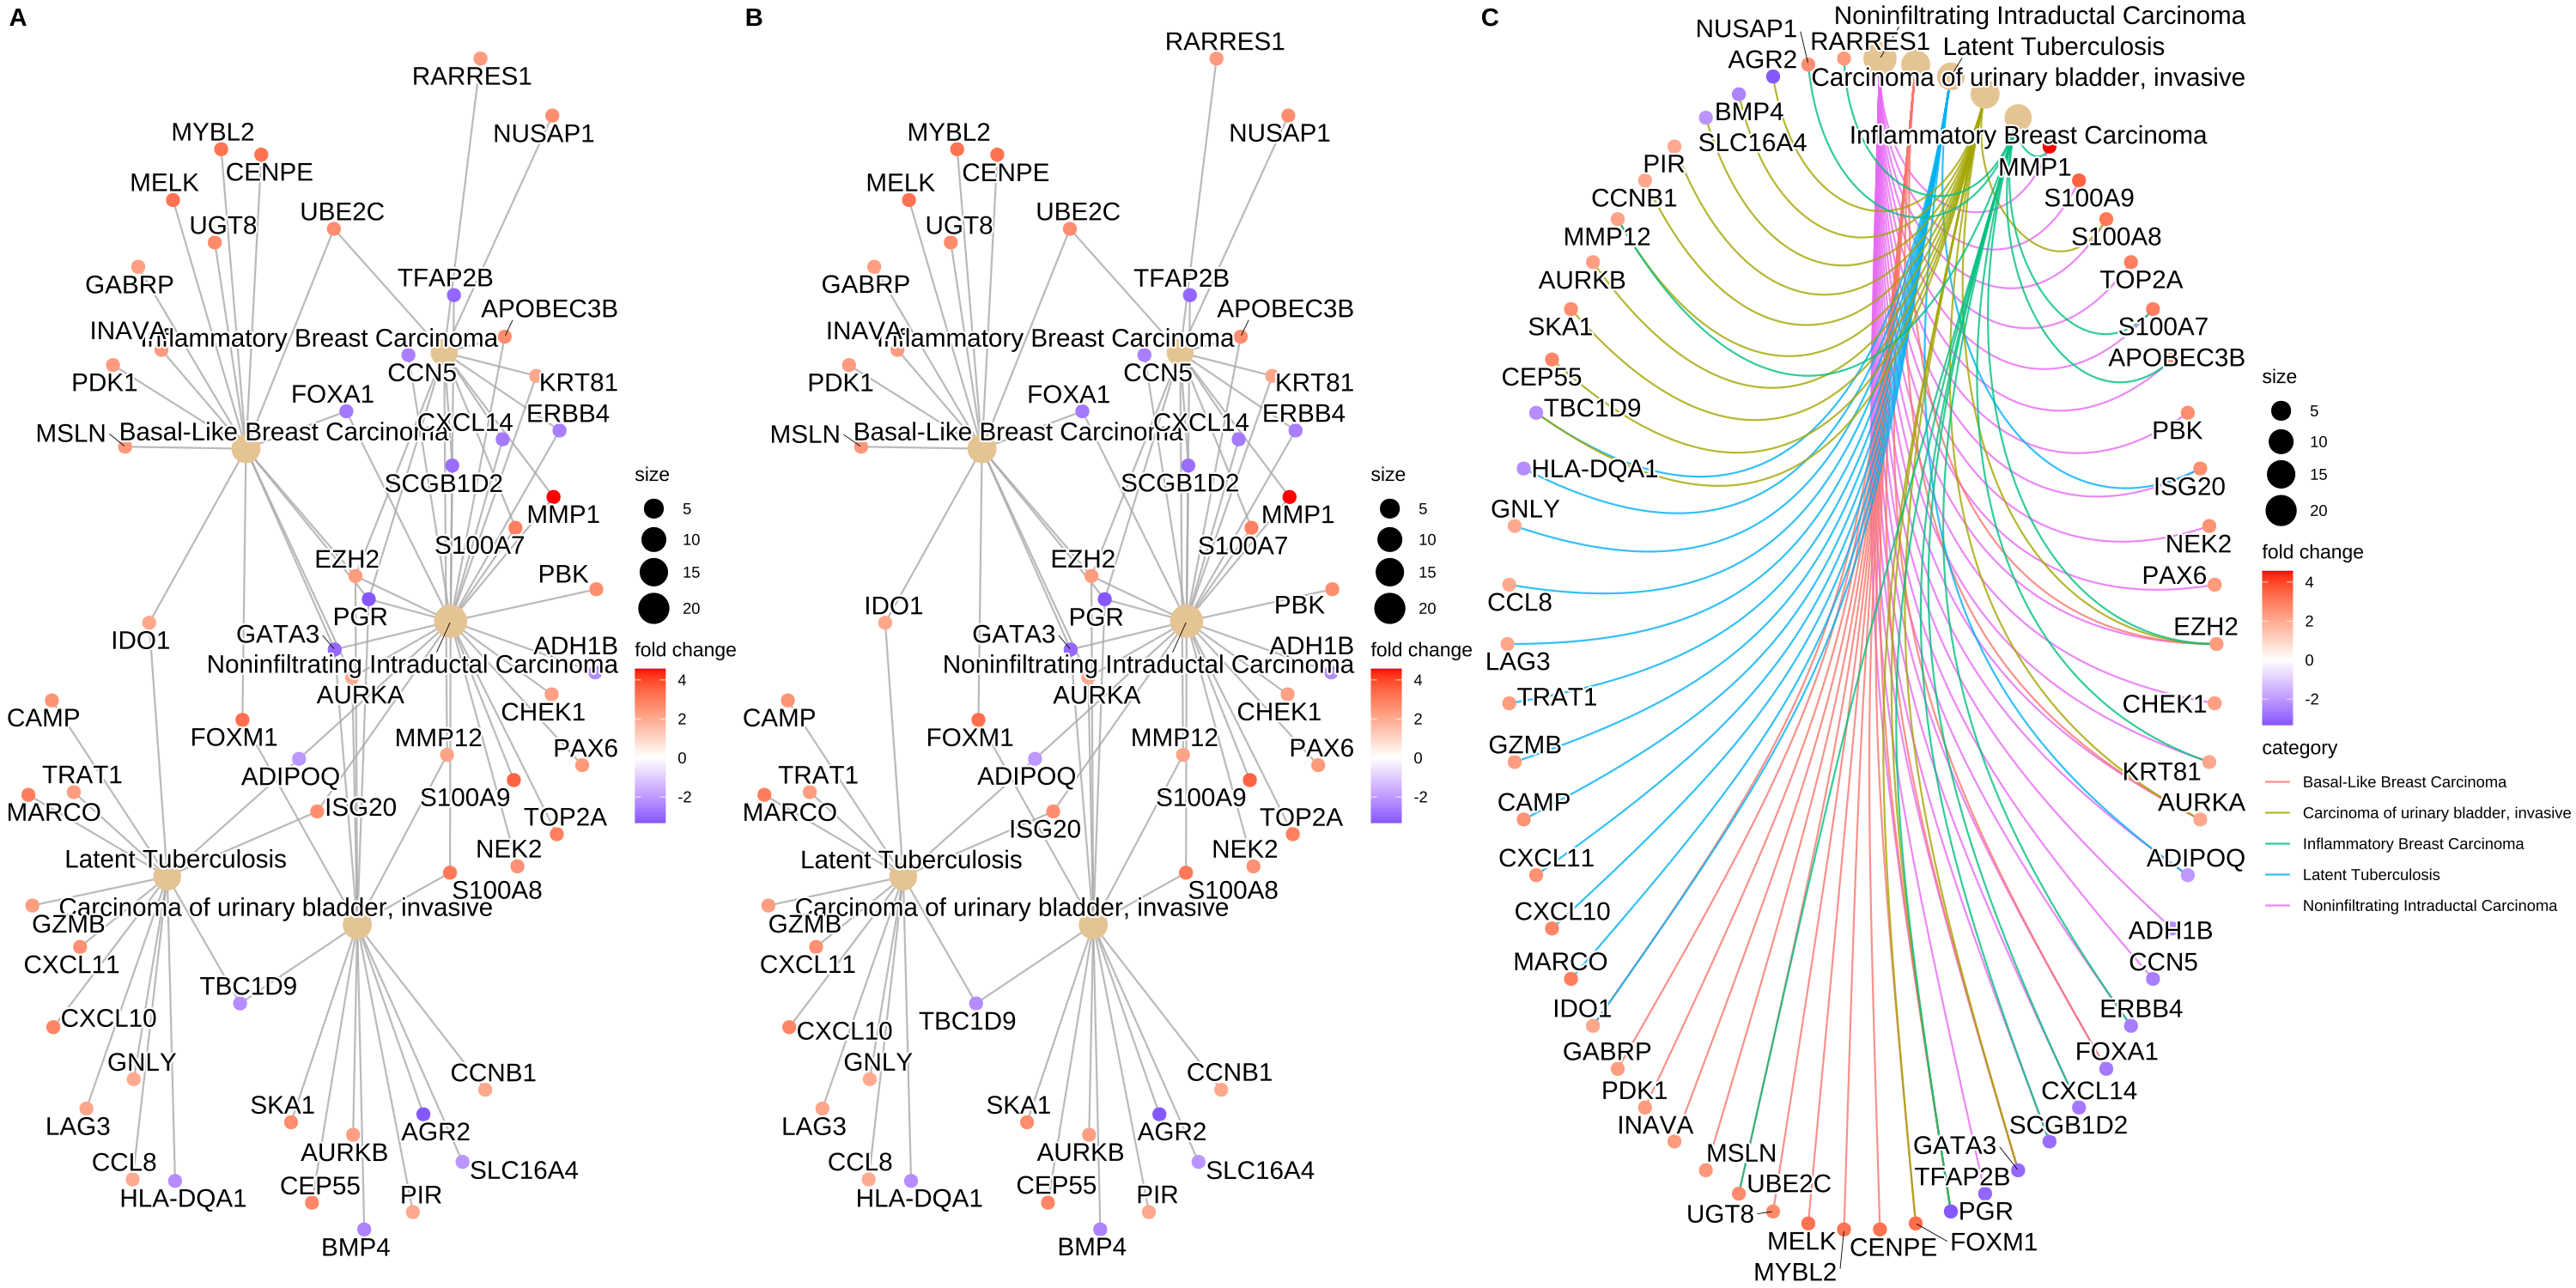
Figure 3. Network plot of enriched terms
from clusterProfiler book
- 可视化heatplot —— 类热图功能分类
同样使用edox。
heatplot类似cnetplot,而显示为热图的关系。
如果用户想要显示大量重要术语,那么类别网络图可能会过于复杂。在heatplot能够简化结果和更容易识别的表达模式。
1 | p1 <- heatplot(edox, showCategory=5) |
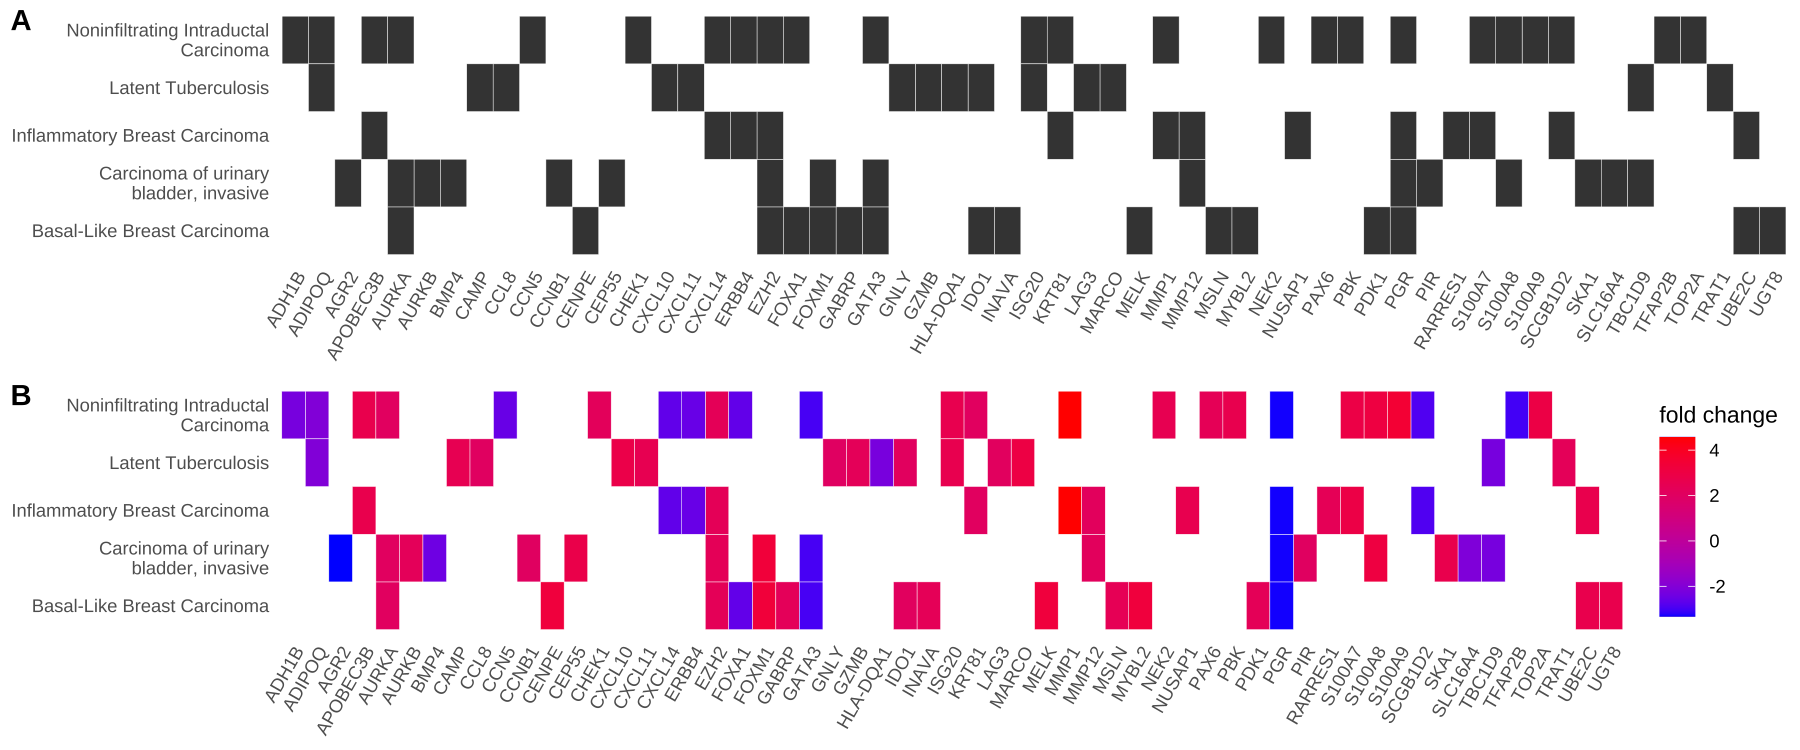
Figure 4. Heatmap plot of enriched terms
from clusterProfiler book
- 可视化treeplot —— 树状图
treeplot()函数执行丰富术语的层次聚类。它依赖于pairwise_termsim()函数计算的丰富项的成对相似性,默认情况下使用 Jaccard 的相似性指数 (JC)。如果支持,用户还可以使用语义相似度值(例如,GO、DO和MeSH)。
默认聚合方法treeplot()是ward.D,用户可以通过hclust_method参数指定其他方法(例如,’average’、’complete’、’median’、’centroid’等。
treeplot()函数会将树切割成几个子树(由nCluster参数指定(默认为 5))并使用高频词标记子树。
1 | edox2 <- pairwise_termsim(edox) |
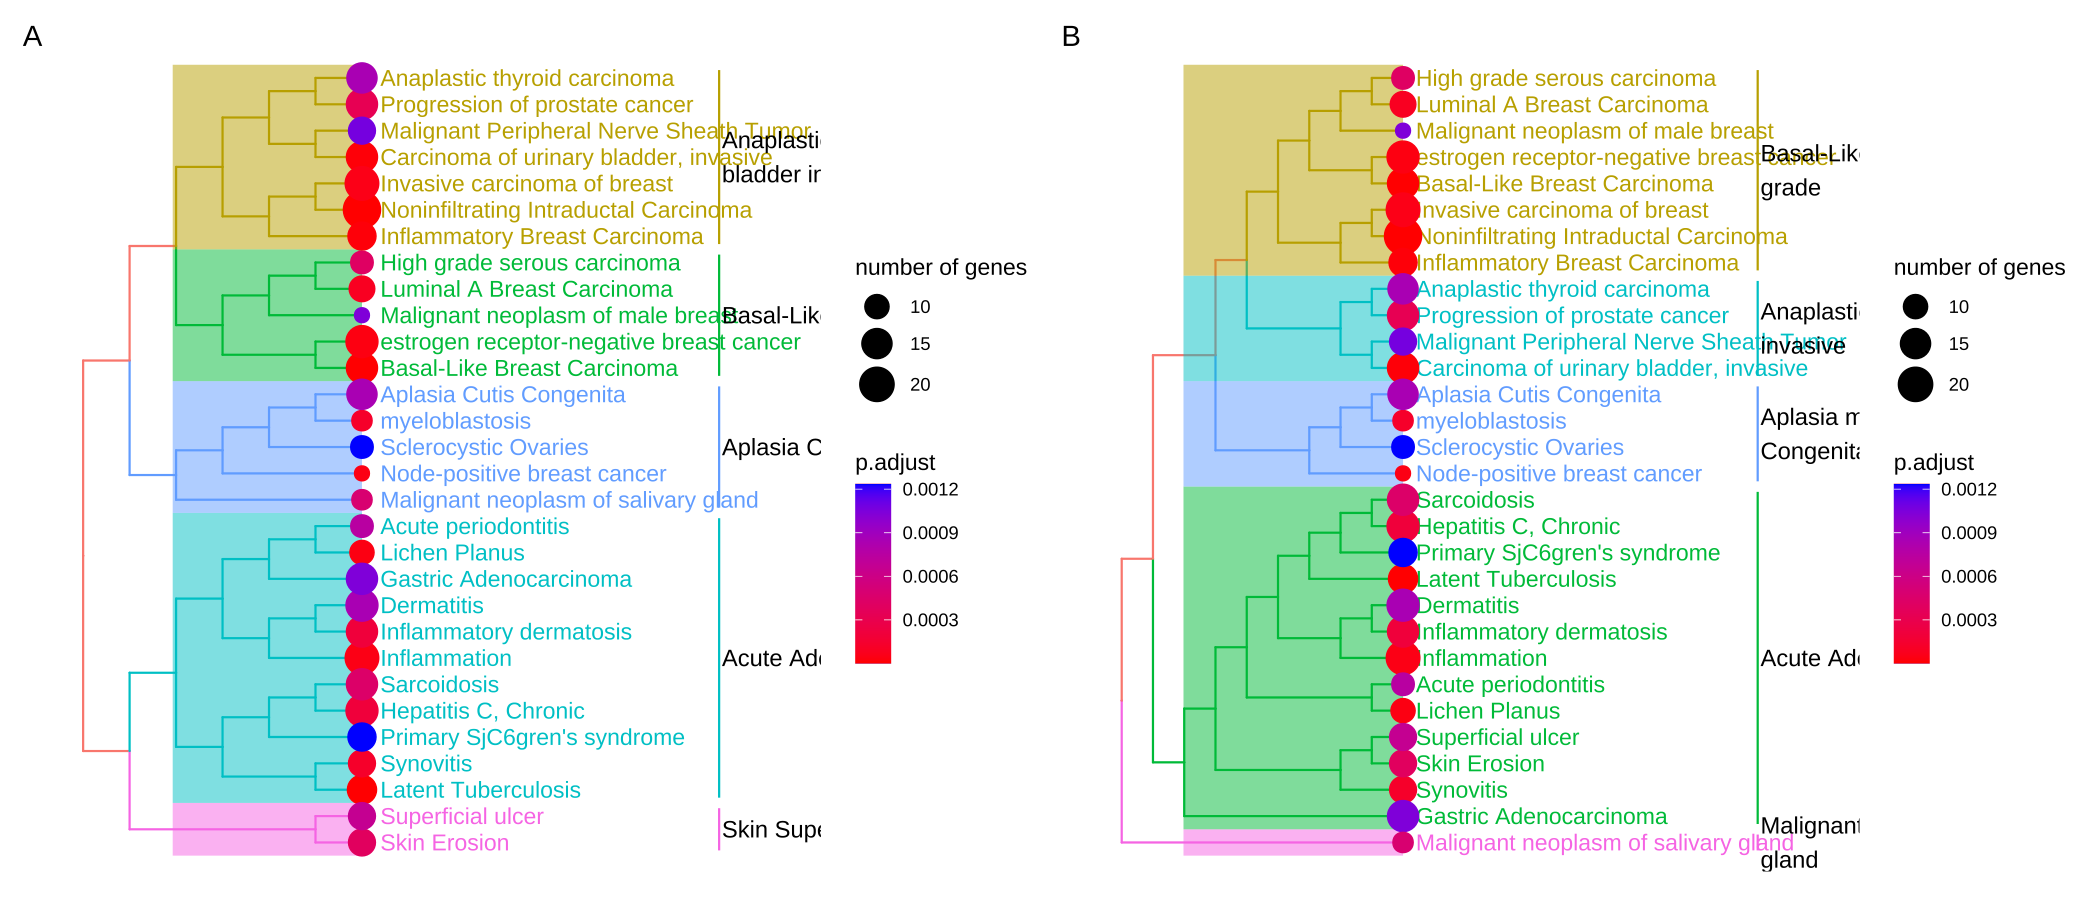
Figure 5. Tree plot of enriched terms
from clusterProfiler book
- 可视化emapplot —— 富集图
对于富集到的GO terms之间的基因重叠关系进行展示,如果两个GO terms系的差异基因存在重叠,说明这两个节点存在overlap关系,在图中用线条连接起来。每个节点是一个富集到的GO term, 默认画top30个富集到的GO terms, 节点大小对应该GO terms下富集到的差异基因个数,节点的颜色对应p.adjust的值,从小到大,对应蓝色到红色。
1 | ego2 <- pairwise_termsim(ego) |
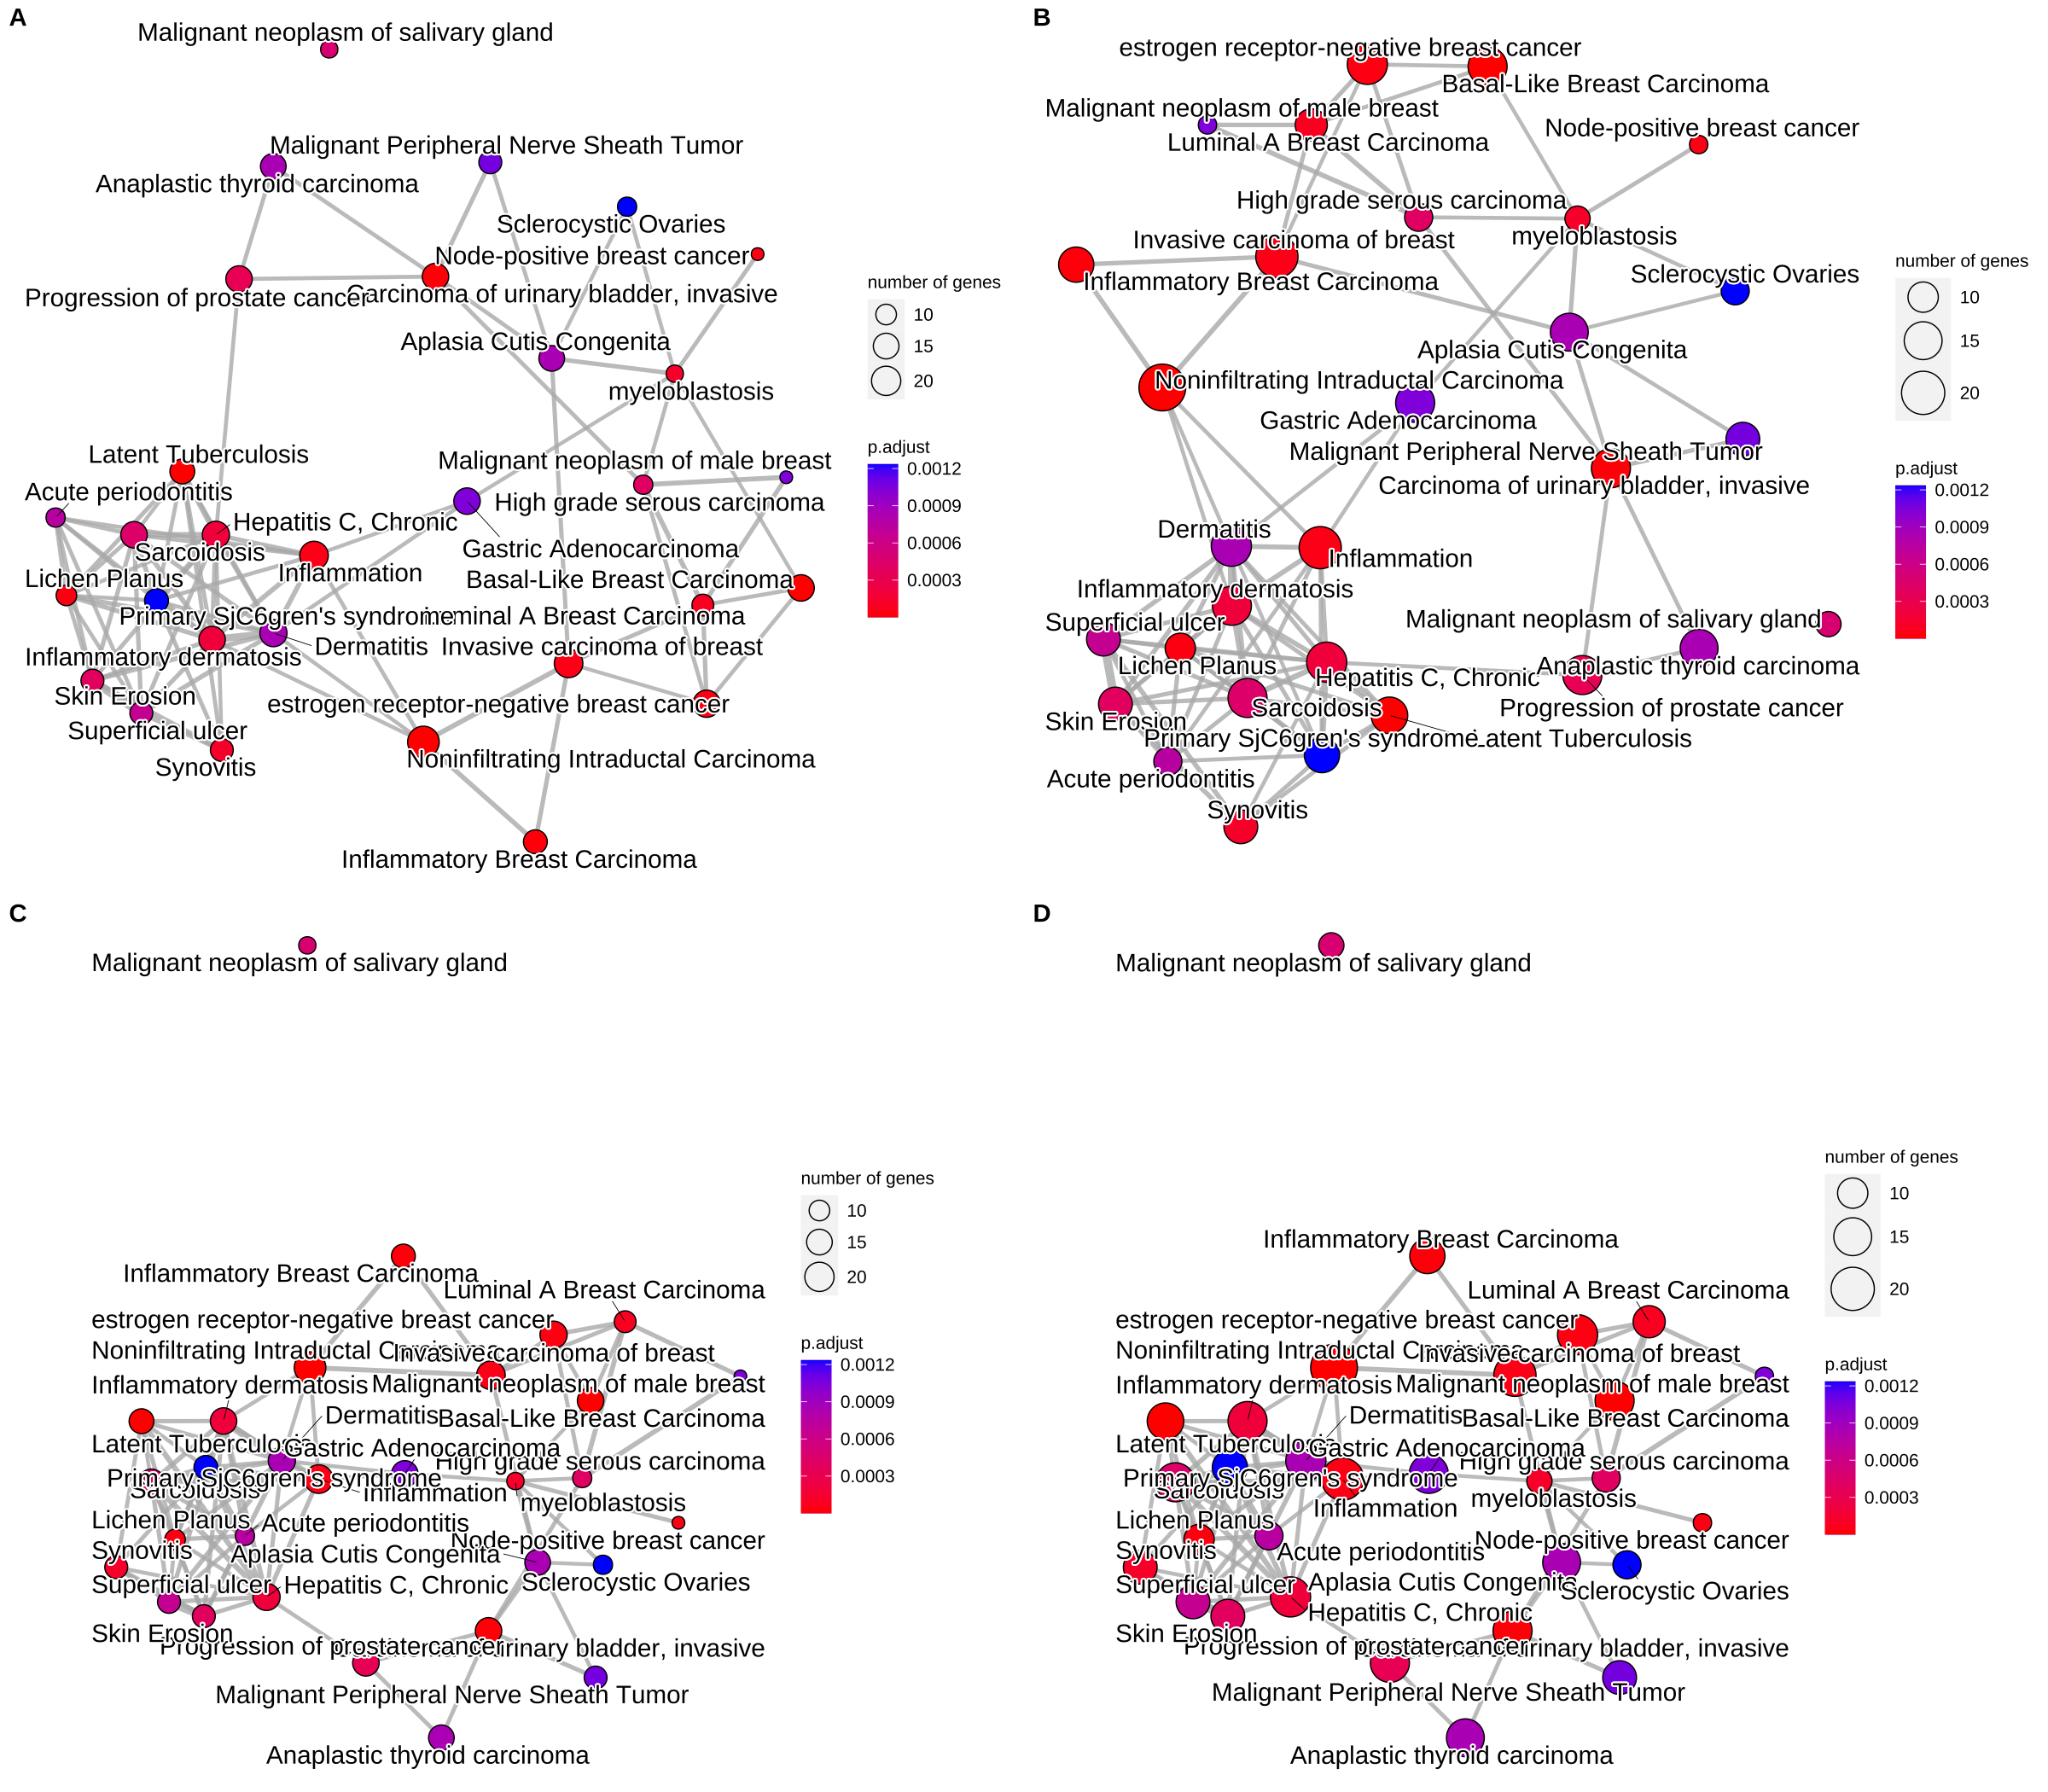
Figure 6. Plot for results obtained from hypergeometric test and gene set enrichment analysis. default (A), cex_category=1.5 (B), layout=”kk” (C) and cex_category=1.5,layout=”kk” (D).
from clusterProfiler book
- 可视化upsetplot —— upset图
upsetplot是cnetplot可视化基因和基因集之间复杂关联的替代方法。它强调不同基因集之间的基因重叠。
upsetplot(ego)
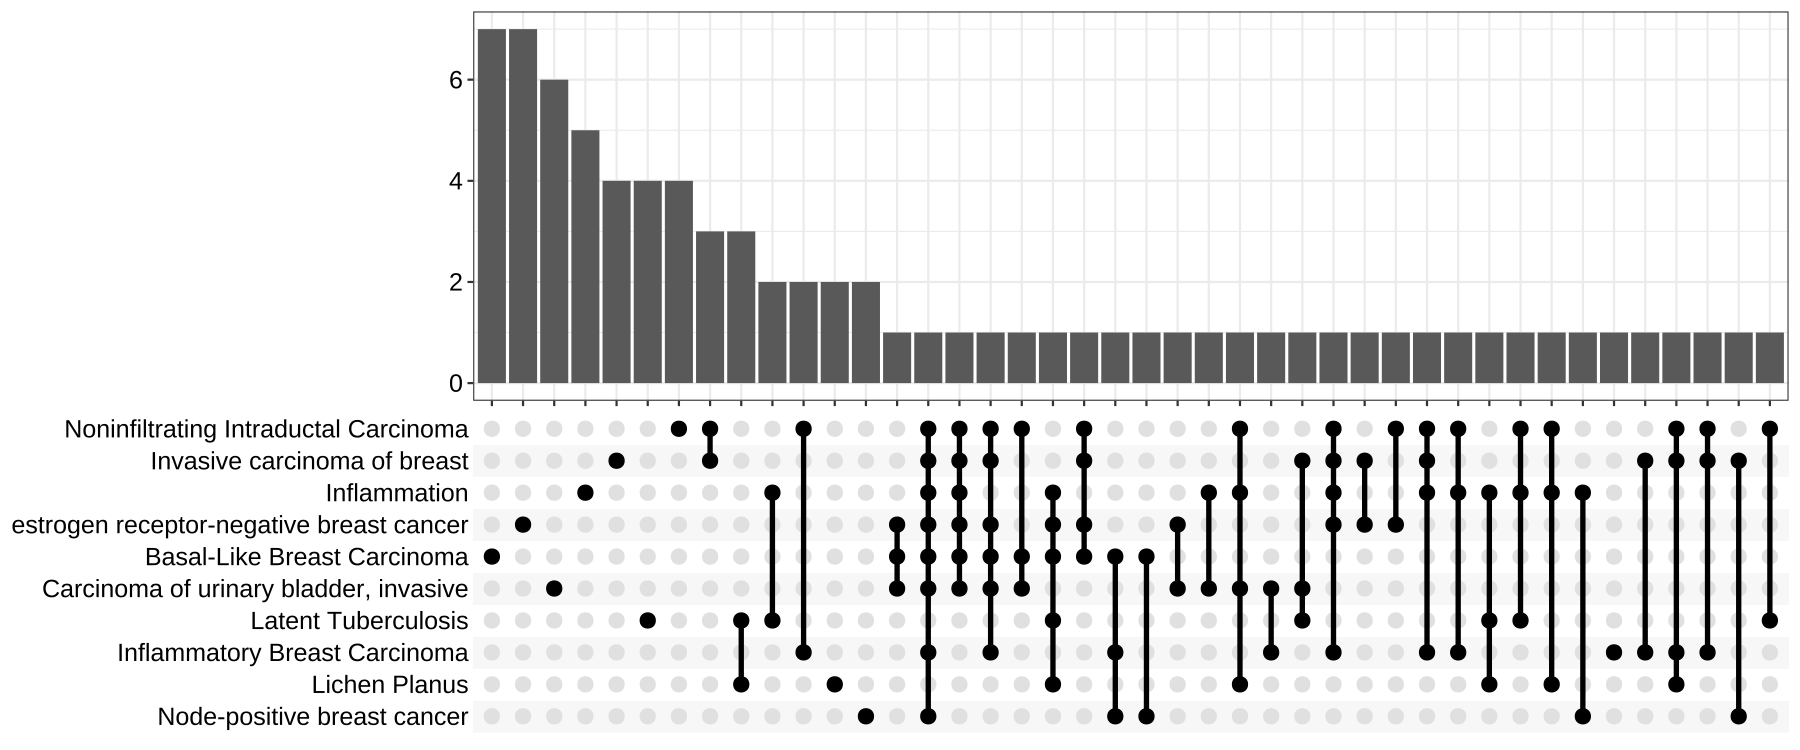
Figure 7. Upsetplot for over-representation analysis.
from clusterProfiler book
- 可视化ridgeplot —— 脊线图
ridgeplot将可视化核心富集基因的表达分布为GSEA富集类别。它帮助用户解释上调/下调的途径。
ridgeplot(ego)
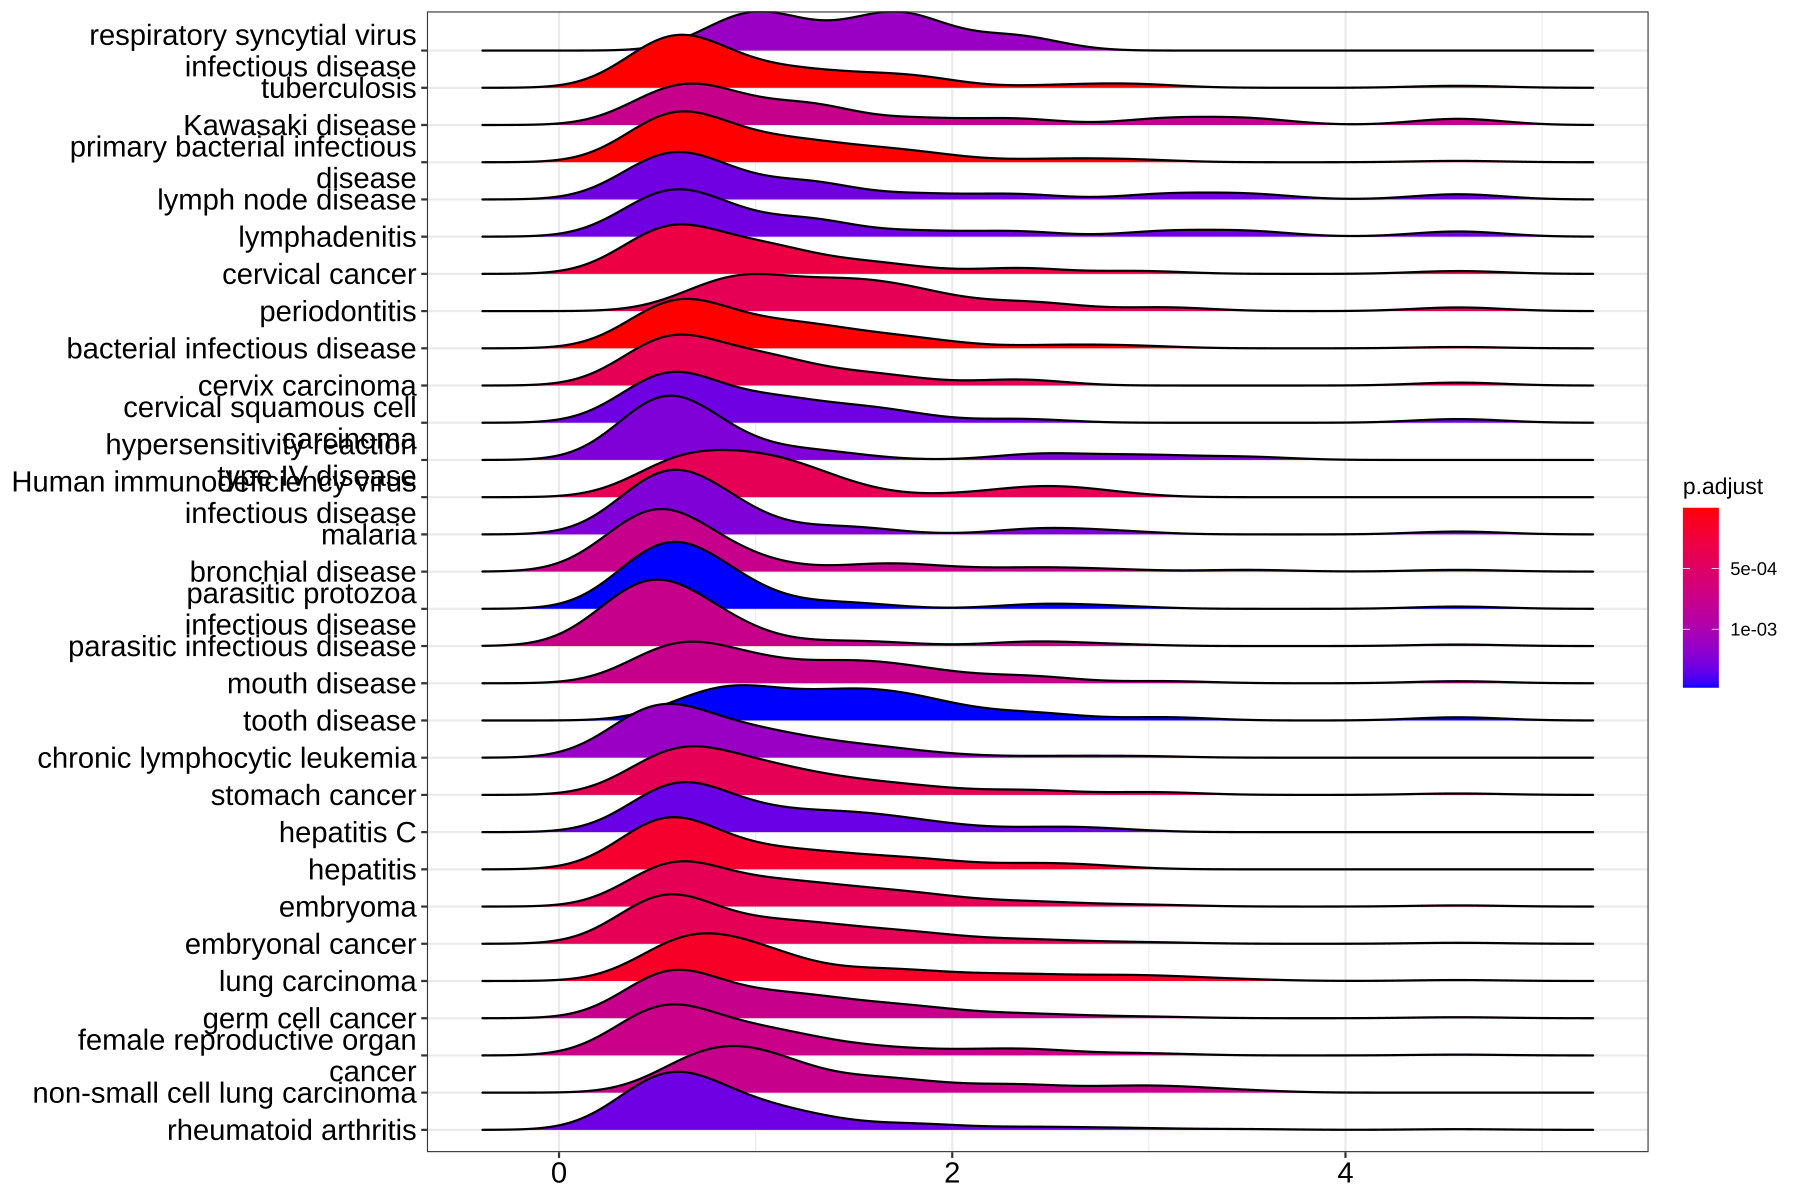
Figure 8. Ridgeplot for gene set enrichment analysis.
from clusterProfiler book
2.2. 可视化plotGOgraph/goplot —— 有向无环图
plotGOgraph(ego, firstSigNodes=10)
- 有向无环图(Directed acyclic graph, DAG),矩形代表富集到的top10个GO Terms,颜色从黄到红,对应p值从大到小。和topGO做富集分析的DAG图一样。
当enrichGO富集分析时ont参数选了ALL时,结果文件会在第一列前增加一列ONTOLOGY为子类,这时直接用于plotGOgraph画图会报错。
试了下,下面两种方案还是会报错Error in if (!ont %in% c(“BP”, “MF”, “CC”)) { :argument is of length zero。。还是尽量在enrichGO分析时就用ont=”BP”吧。
- 可以在结果文件中筛选出特定子类(比如BP)的结果行,并删除第一列ONTOLOGY后保存文件,再读进R用于plotGOgraph画图。
- 也可以在R内用命令
ego2<-ego%>%filter(ONTOLOGY== "BP")筛选BP子类,接着用ego3<-ego2%>%select(!ONTOLOGY)或者ego3<-ego2[,-1]删除第一列(即ONTOLOGY列),然后用plotGOgraph(ego3)作图。

Figure 9. DAG图
from clusterProfiler blog
goplot(ego, showCategory = 10)
- igraph布局方式的有向无环图
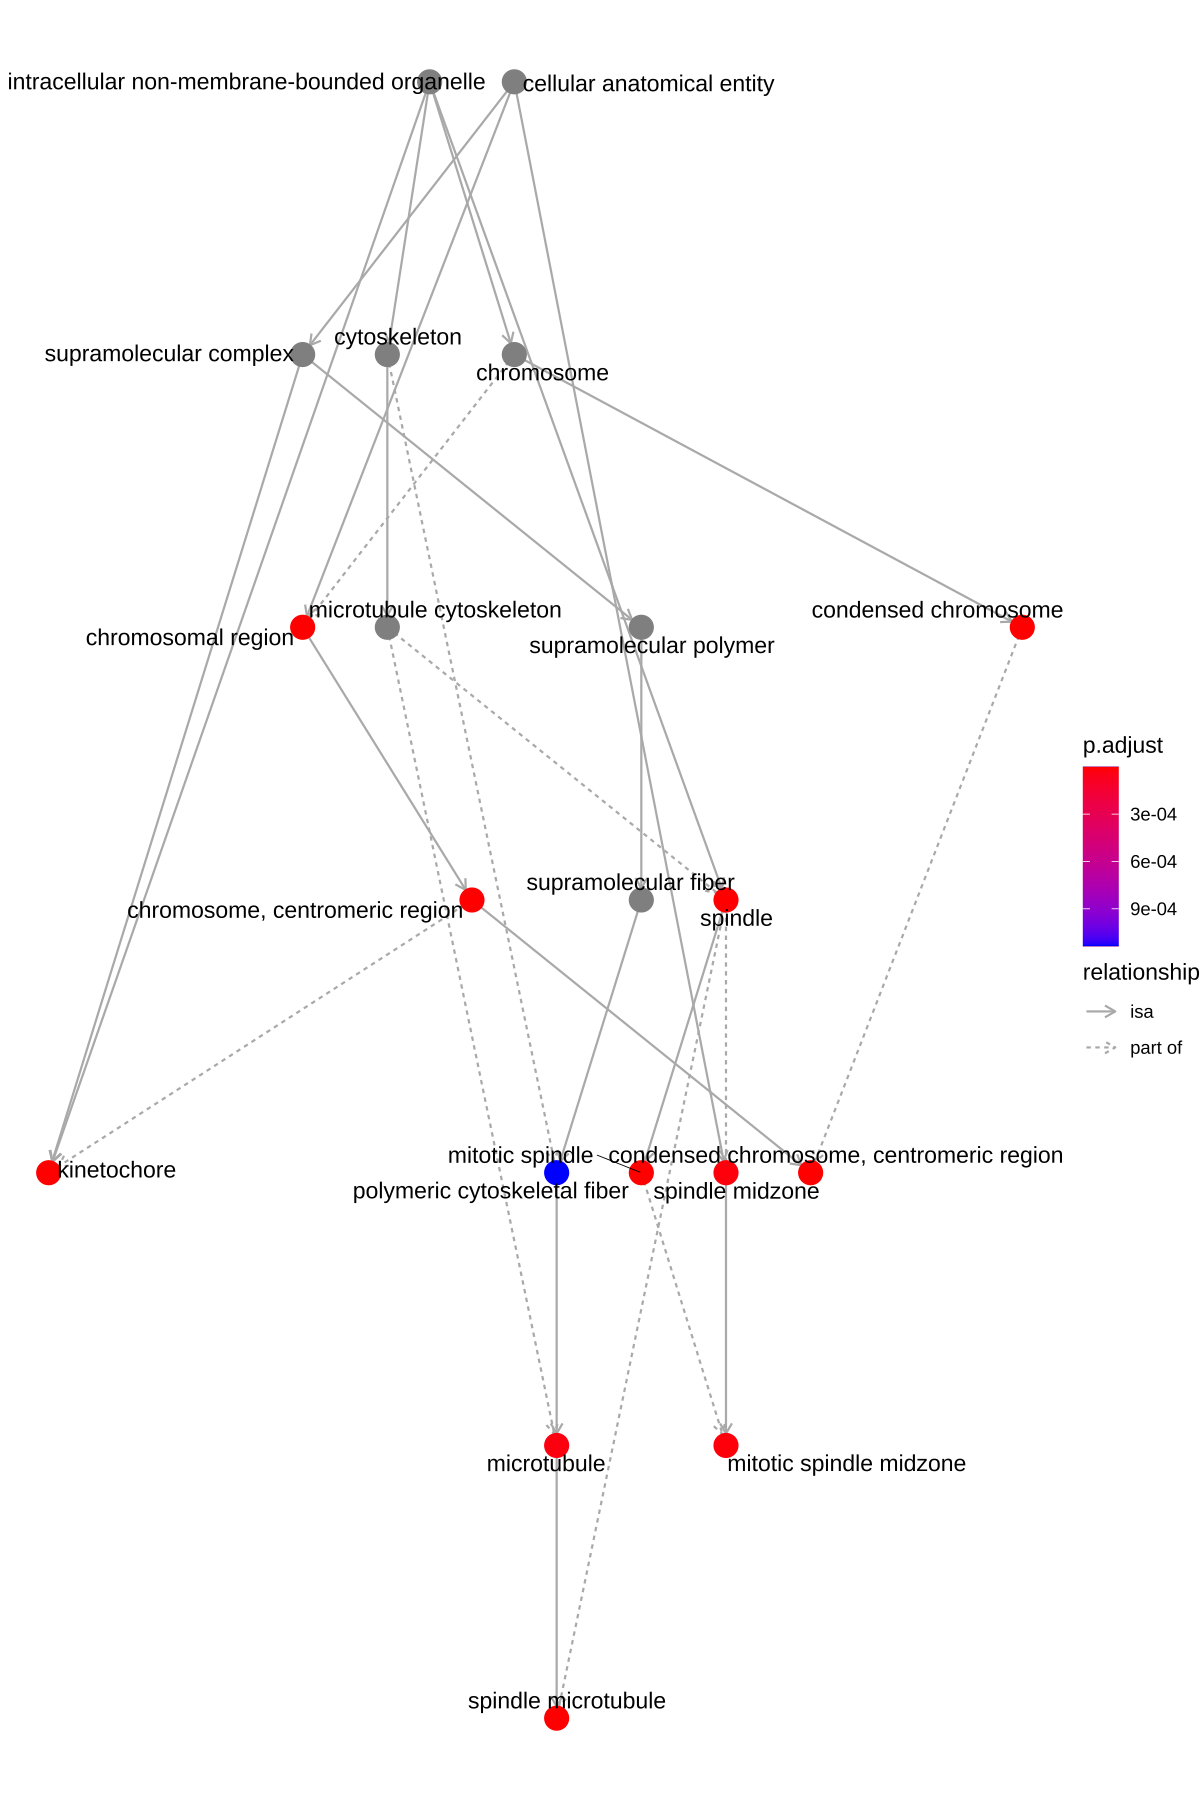
Figure 10. goplot的DAG图
from clusterProfiler book
2.3. 可视化 —— wordcloud
词云的方式显示结果
1 | install.packages("wordcloud") |
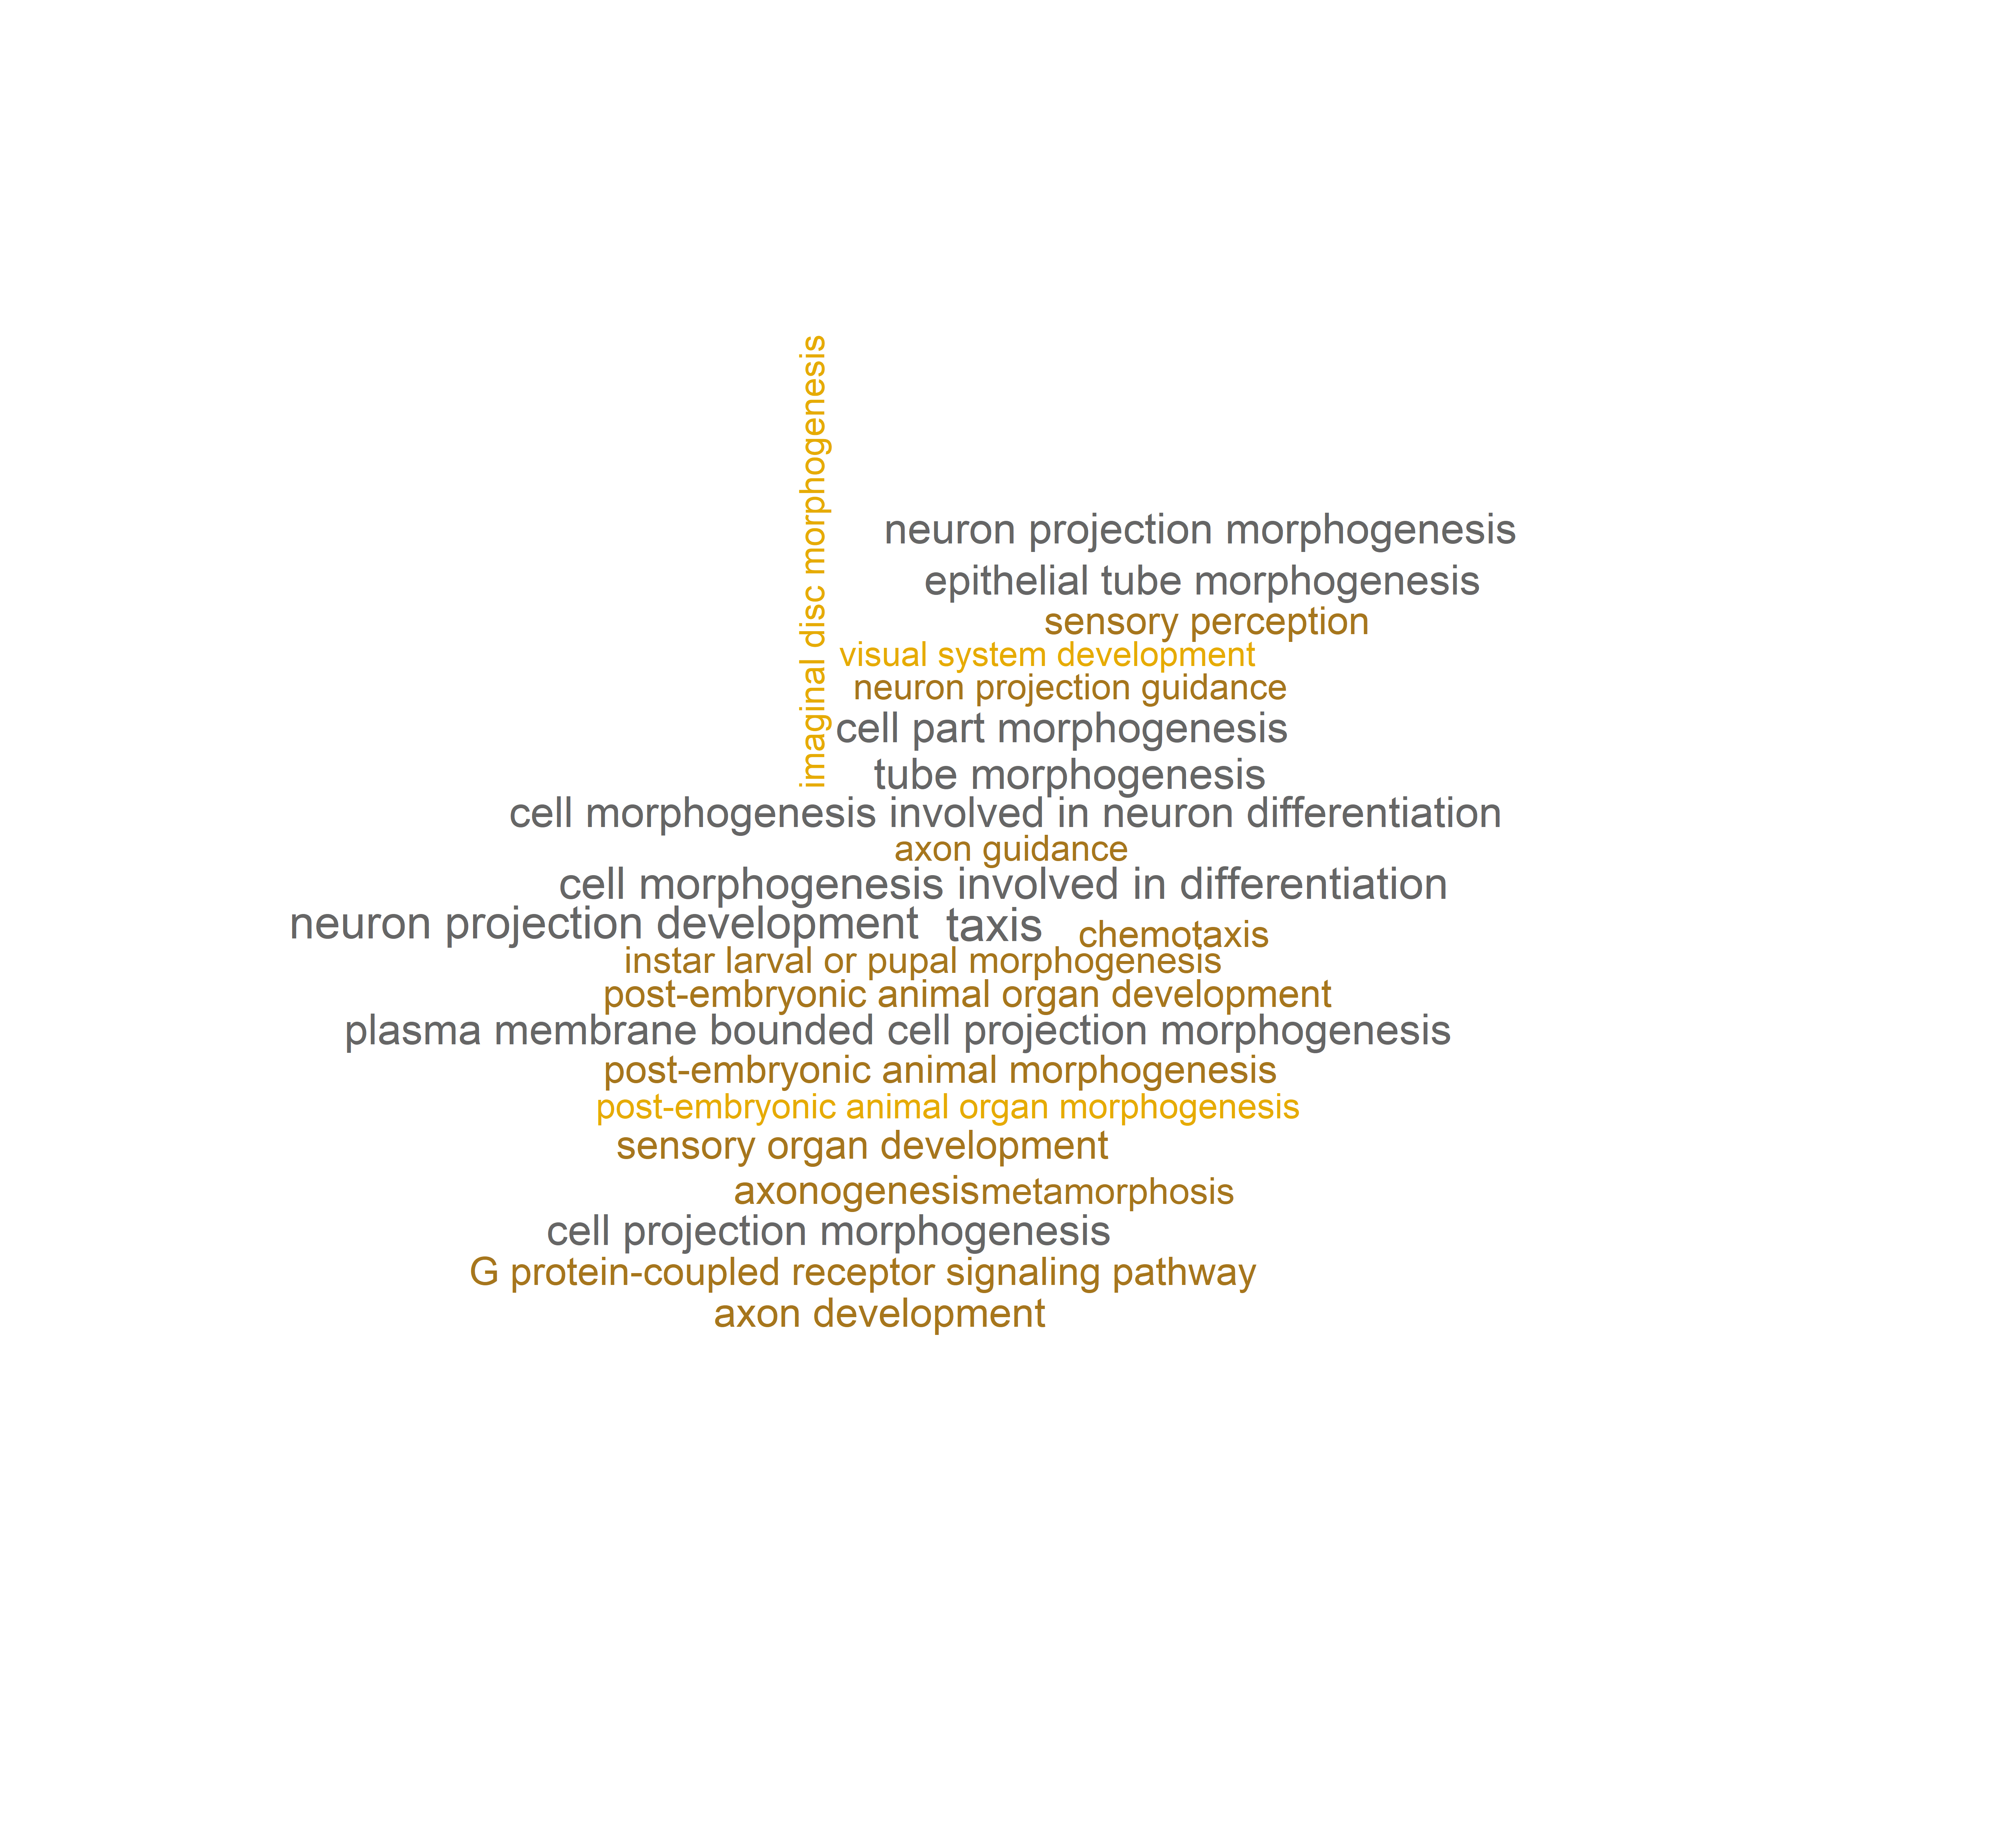
Figure 11. wordcloud词云图
from NGS Analysis ebook
3. 导出可视化结果
- Rstudio
如果是在Rstudio中,可以直接看到绘图结果,导出需要的文件格式即可。
- 代码导出
1
2
3
4pdf("ego.pdf") #如果保存png,就改成png("ego.png")
ego_fig<-barplot(x) #画图函数
print(ego_fig) #画到pdf文件
dev.off() #关闭pdf画板
4. references
- clusterProfiler github:https://github.com/YuLab-SMU/clusterProfiler
- clusterProfiler paper:https://www.cell.com/the-innovation/fulltext/S2666-6758(21)00066-7?_returnURL=https%3A%2F%2Flinkinghub.elsevier.com%2Fretrieve%2Fpii%2FS2666675821000667%3Fshowall%3Dtrue
- clusterProfiler book:http://yulab-smu.top/biomedical-knowledge-mining-book/index.html
- clusterProfiler manual:https://bioconductor.org/packages/devel/bioc/manuals/clusterProfiler/man/clusterProfiler.pdf
- clusterProfiler ducumentation:https://guangchuangyu.github.io/software/clusterProfiler/documentation/
- 其他来源结果可视化:https://cloud.tencent.com/developer/article/1613815
- wordcloud:https://learn.gencore.bio.nyu.edu/rna-seq-analysis/over-representation-analysis/
- 欢迎关注微信公众号:生信技工
- 公众号主要分享生信分析、生信软件、基因组学、转录组学、植物进化、生物学概念等相关内容,包括生物信息学工具的基本原理、操作步骤和学习心得。


